
In the Cockpit team we recently started to generate and export metrics about our CI, and collect/graph them by a Red Hat internal Prometheus and Grafana instance. But I am not happy with this yet, as it does not yet answer all the questions that we have for it. Also, it is not accessible outside of Red Hat.
On today’s Red Hat Day of Learning I wanted to get to know how to deploy these components and learn more about the PromQL language.
The deployment part is actually really simple – starting two containers in a pod in unprivileged user podman does the trick and already does something useful. Pre-configuring the Prometheus data source in Grafana is also simple, and saves a few clicks in the UI.
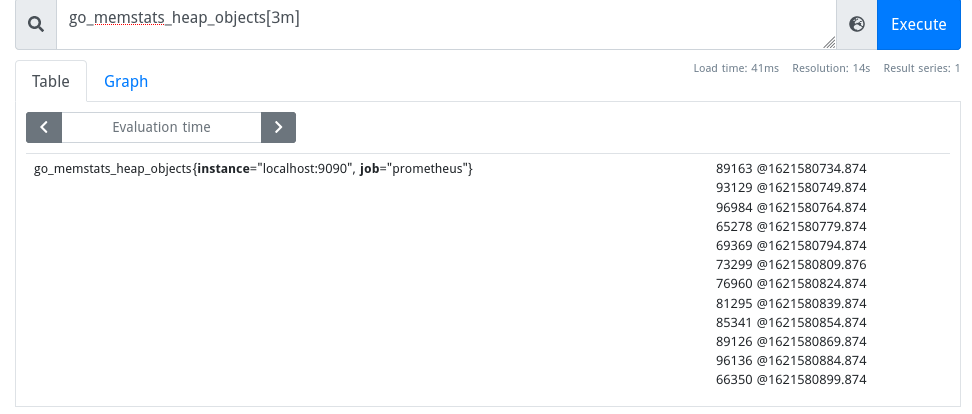
Then I could query Prometheus’ own metrics in the simple Prometheus UI on http://localhost:3001:
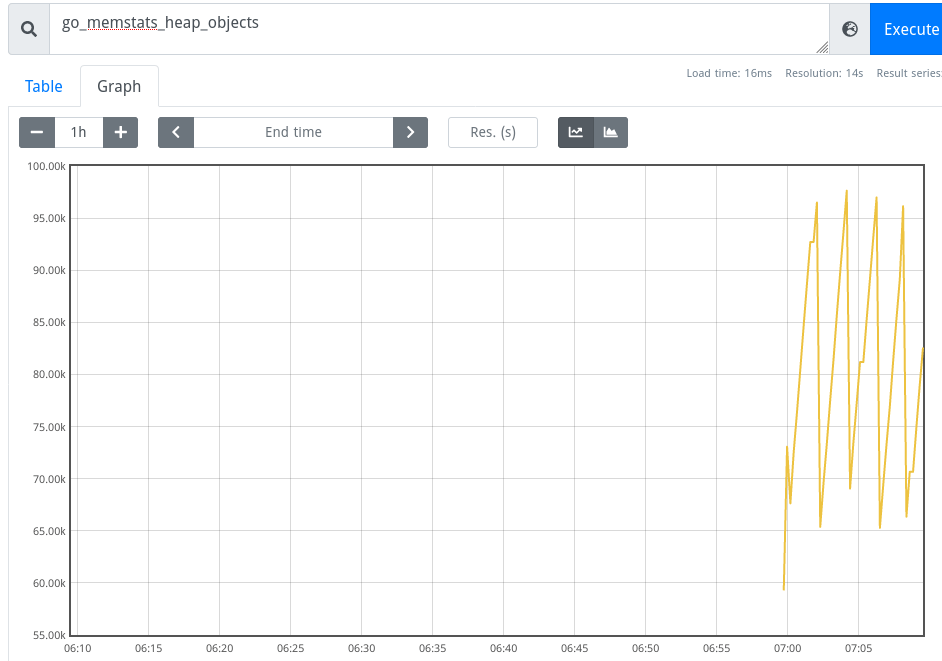
… or graph them:
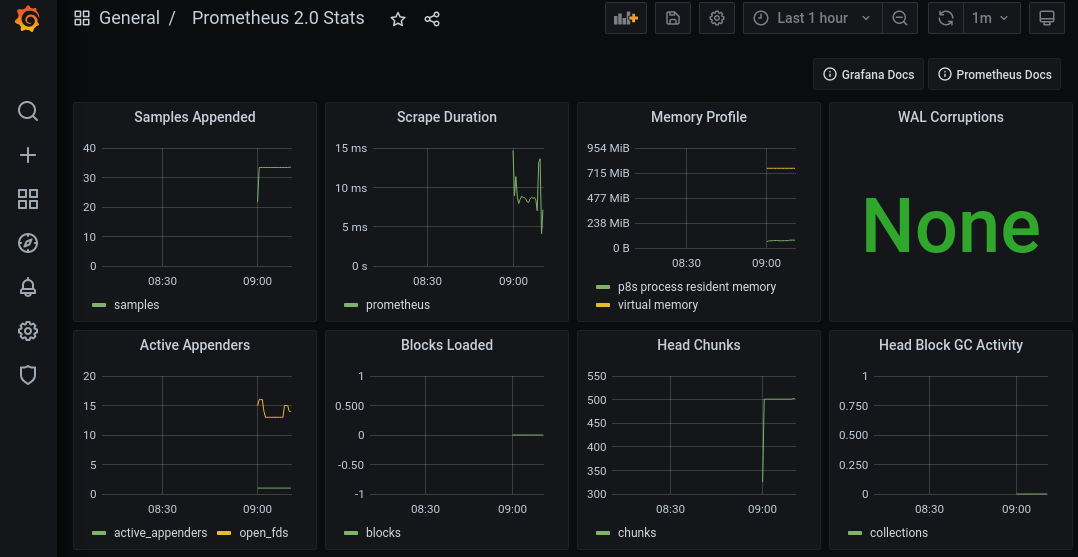
The Prometheus Grafana data source comes with pre-defined dashboards, which can be enabled with two clicks in Grafana on http://localhost:3000:
To make this a little more interesting, I converted my initial launch shell script to a kubernetes resource. This can be deployed directly into some kubernetes/OpenShift, but more also locally with podman:
podman play kube learn-metrics.yaml
And voilà, a few seconds later:
$ podman ps
872e0e58b957  quay.io/bitnami/grafana:latest                          35 seconds ago  Up 30 seconds ago  0.0.0.0:3000->3000/tcp, 0.0.0.0:3001->9090/tcp  learn-metrics-grafana
a91300faf49a  docker.io/prom/prometheus:latest  --config.file=/et...  32 seconds ago  Up 30 seconds ago  0.0.0.0:3000->3000/tcp, 0.0.0.0:3001->9090/tcp  learn-metrics-prometheus
This is great for testing things locally, deploy them to production when ready, and obsoletes the need for docker compose files (which sort of work with podman as well, but not with user podman).
Then I added some plumbing to import a custom data source and a script to generate a demo time series.
Then I looked into the basics of PromQL. Our current Cockpit CI exports data gauges which is already pre-processed to a specific “look-back” interval, like “how many tests failed in the last 24 hours”. This makes it awkward to generate a view how this metric develops over longer time periods like 28 days – the whole point of these queries is to not pre-process your data at the source, but do that at query time.
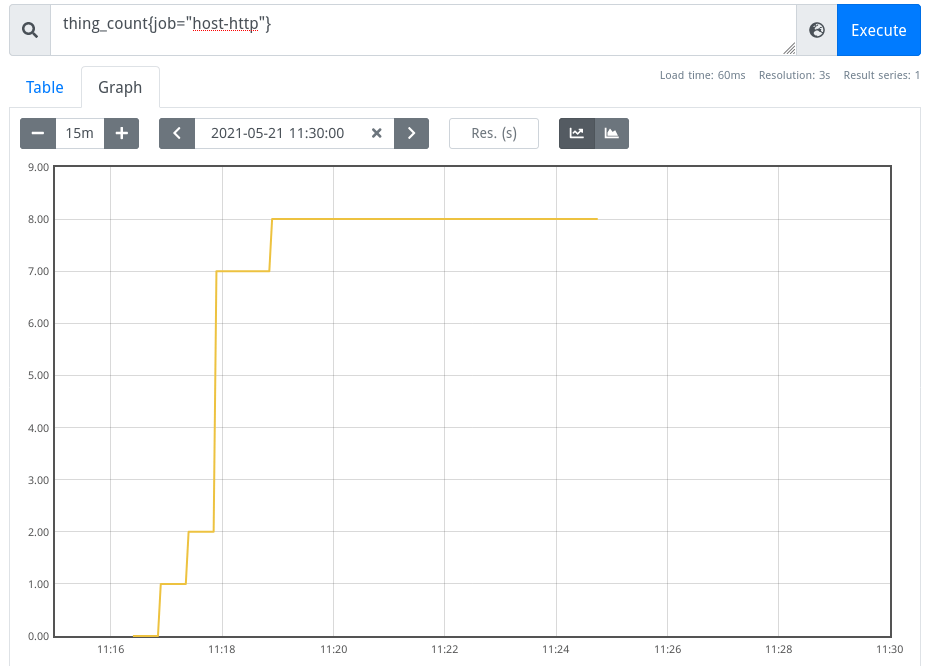
So for this demo the thing_count and thing_failures metrics are both raw
counters instead of gauges, and thus much more amenable to functions/operators.
So this raw counter:
can be turned into any arbitrary look-back window with a query like this (for 5 minutes):

In the next days I’ll apply this knowledge to the Cockpit CI metrics, and also look into setting up a public Grafana instance to replace our weather report (which takes ages to load these days..)